Is it clear enough to observe the interaction between z and x from these bubble plots?
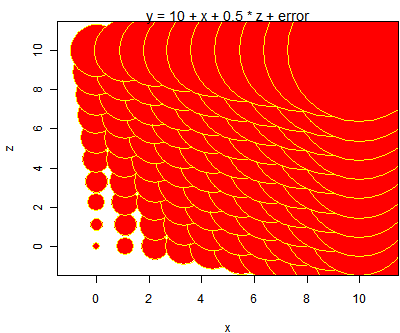
If there is no interaction between x and z, the size of bubbles will increase at the same rate while either x or z is fixed.
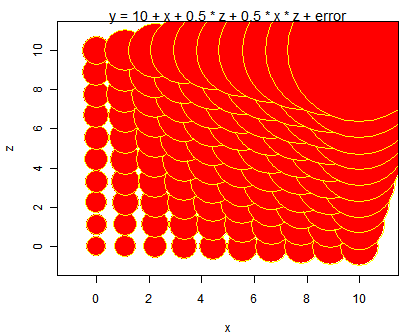
But when interaction exists, the rate of increasing will be different.
R code:
sq = 1:10
x = rep(sq, 10)
z = rep(sq, each = 10)
y = c(outer(sq, sq, function(x, z) 10 + 1 * x + 0.5 *
   z + 0.5 * x * z + runif(1)))
symbols(x, z, y, bg = "red", fg = "yellow",
   main = "y = 10 + x + 0.5 * z + 0.5 * x * z + error")
y = c(outer(sq, sq, function(x, z) 1 * x + 0.5 * z + runif(1)))
symbols(x, z, y, bg = "red", fg = "yellow",
  main = "y = 10 + x + 0.5 * z + error")