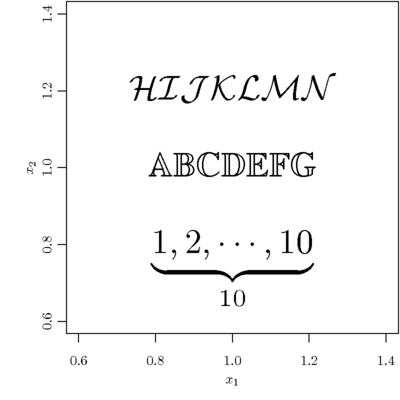
I remember a few weeks ago, there was a challenge in the R-help list to make the prime symbol in R graphics. In LaTeX, we simply write $X'$ or $X^\prime$. R has a rough support for math expressions (see demo(plotmath)) and they are certainly unsatisfactory for LaTeX users. In fact we can write native LaTeX code in R plots via the tikzDevice package! Why bother to use all kinds of tricks to cheat R? :)
Here is an example per request of a reader of my blog:

library(tikzDevice)
options(tikzMetricPackages = c("\\usepackage[utf8]{inputenc}",
    "\\usepackage[T1]{fontenc}", "\\usetikzlibrary{calc}",
    "\\usepackage{amssymb}"))
## I need the amssymb package because I use \mathcal and \mathbb
tikz("formula.tex", width = 4, height = 4, standAlone = TRUE,
    packages = c("\\usepackage{tikz}",
                 "\\usepackage[active,tightpage,psfixbb]{preview}",
                 "\\PreviewEnvironment{pgfpicture}",
                 "\\setlength\\PreviewBorder{0pt}",
                 "\\usepackage{amssymb}"))
par(mar = c(4, 4, 0.1, 0.1), mgp = c(2, 0.9, 0))
plot(1, type = "n", xlab = "$x_1$", ylab = "$x_2$")
text(1, c(0.8, 1, 1.2), c("$\\underbrace{1,2,\\cdots,10}_{10}$",
    "$\\mathbb{ABCDEFG}$", "$\\mathcal{HIJKLMN}$"), cex = 2.5)
dev.off()

tools::texi2pdf("formula.tex")
system(paste(getOption("pdfviewer"), "formula.pdf"))