Today Romain Francois posted an interesting topic in the R-help list, and you can read his blog post for more details: celebrating R commit #50000. 50000 is certainly not a small number; we do owe R core members a big “thank you” for their great efforts in this fantastic statistical language in the 13 years. When I saw Romain’s data, I suddenly remembered a question I asked to one of Prof Ripley’s student a couple of years ago: does Prof Ripley ever sleep? And he answered “No!”. No wonder we can see Prof Ripley so frequently in the R-help/devel mailing list. If you have stayed on R-help list for enough long time, you’ll surely know several facts, e.g. Martin Maechler will arrive in less than 3 minutes if you dare call an R package “library”, and you will get “Ripleyed” if you are not careful enough in posting your R code.
> library(fortunes)
> fortune("Ripleyed")

And the fear of getting Ripleyed on the mailing list also makes me think, read,
and improve before submitting half baked questions to the list.
 -- Eric Kort
 R-help (January 2006)
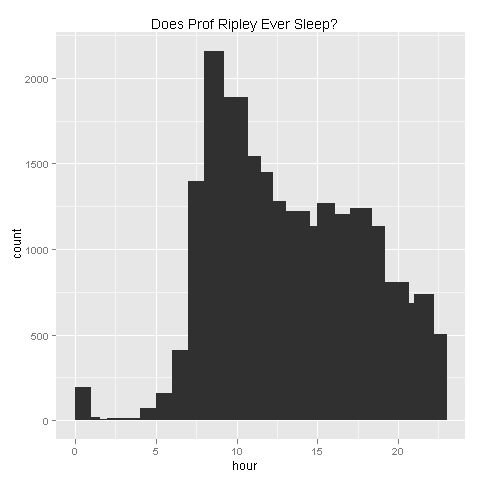
While these facts are revealing their great efforts in helping R users, we can see their work hours in committing revisions to R. For example, the answer to my question is clear in the graph below:

## R code borrowed from Romain Francios
process_chunk <- function(txt) {
  if (length(txt) == 1L)
    return(NULL)
  header_line <- strsplit(txt[2L], " | ", fixed = TRUE)[[1]][c(1L, 2L, 3L)]
  revision <- substring(header_line[1], 2)
  author <- header_line[2]
  if (author %in% c("apache", "root"))
    return(NULL)
  date <- substring(header_line[3], 1, 25)
  nlines <- length(date)
  matrix(c(rep.int(revision, nlines), rep.int(author, nlines),
           rep.int(date, nlines)), nrow = nlines)
}
data <- local({
  lines <- readLines("rsvn.log")
  index <- cumsum(grepl("^-+$", lines))
  commits <- split(lines, index)
  do.call(rbind, lapply(commits, process_chunk))
})
colnames(data) <- c("revision", "author", "date")
simple <- data[!duplicated(data[, "revision"]), ]
hour.data = data.frame(author = simple[, "author"],
                       hour = as.integer(substr(simple[, "date"], 12, 13)),
                       year = as.integer(substr(simple[, "date"], 1, 4)))
hour.data = subset(hour.data, year >= 1997 & (author %in%
  c("hornik", "maechler", "pd", "ripley")))
library(ggplot2)
# png("ripley-work-hour.png")
qplot(hour, data = subset(hour.data, author == "ripley"),
      main = "Does Prof Ripley Ever Sleep?") + stat_bin(binwidth = 1)
# dev.off()
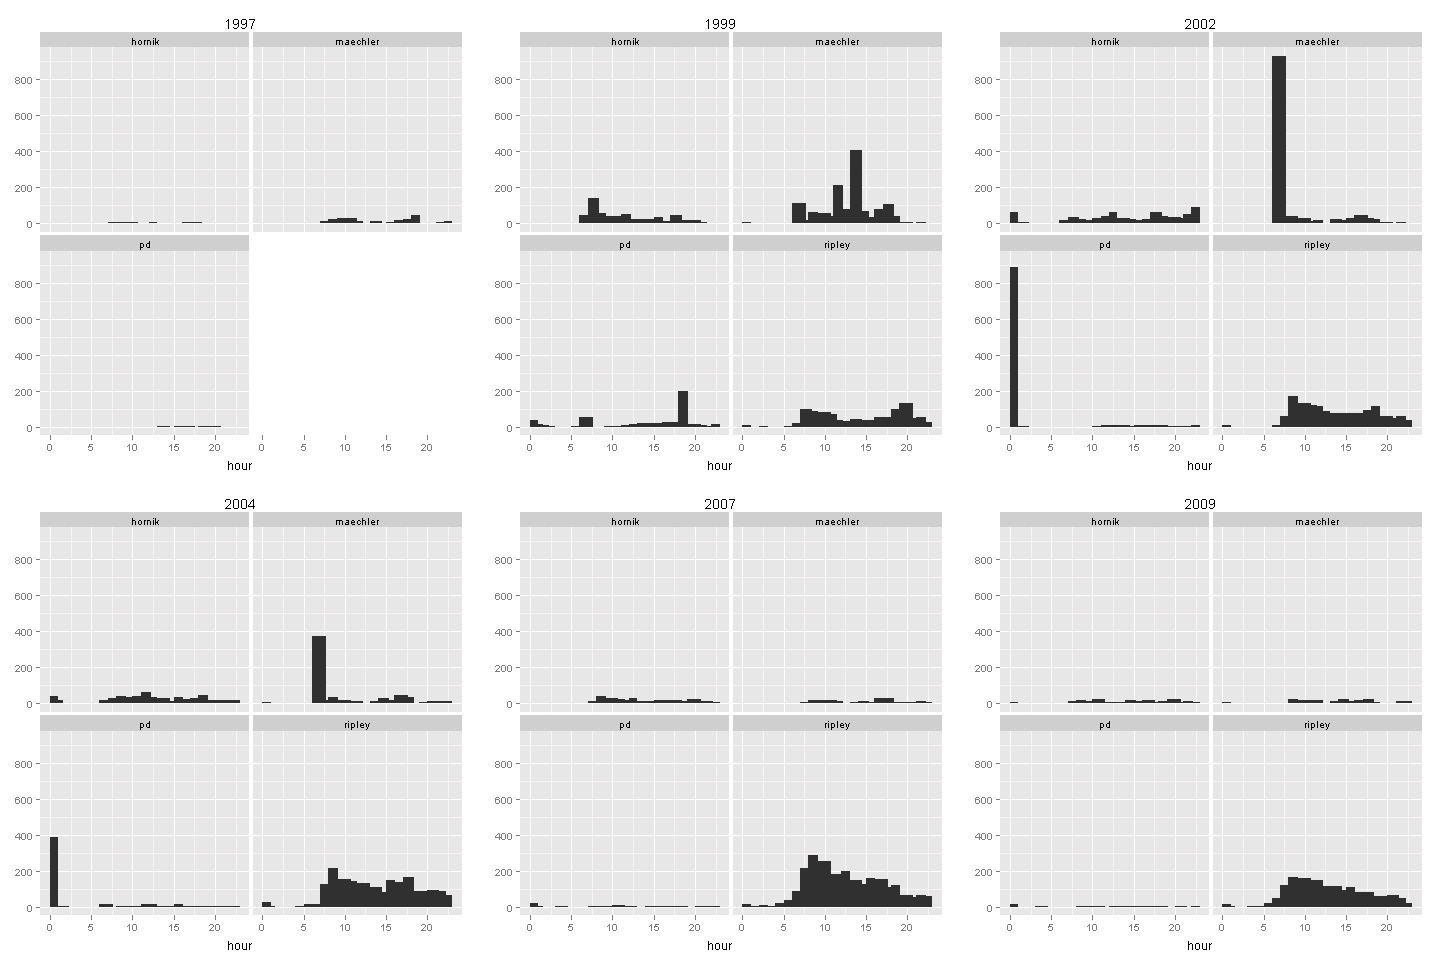
Here I only selected four authors who have largest number of commits during 1997~2009. We can see the changes of working hours along these years:

hour.max = max(with(hour.data, table(author, year, hour)))
library(animation)
# you need ImageMagick to create the GIF animation!
saveMovie({
for (i in sort(unique(hour.data$year))) {
  print(qplot(hour, data = subset(hour.data, year == i), xlim = c(0,
    23), ylim = c(0, hour.max), main = i) + facet_wrap(~author) +
    stat_bin(binwidth = 1))
}
}, interval = 1.5, moviename = "r-core-work-hour", outdir = getwd())
The patterns are clear: Kurt does not like burning night oil; Martin tends to work very early in the morning (esp during 2000~2004); Peter always work at mid-night (highly centered around 12pm); and for Prof Ripley, he works round the clock but most in the morning (probably that’s when he begins to ``Ripley’’ users? after that time, less people dare to report bugs so his work decays exponentially?)