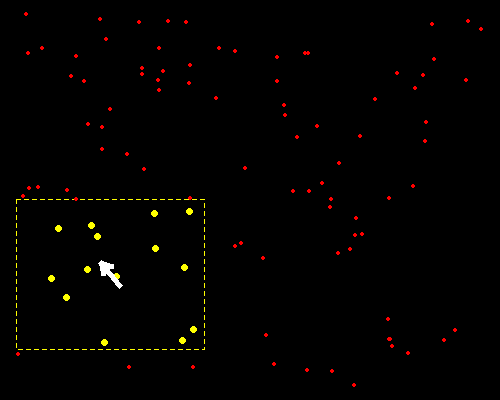
Here is an example of dynamically selecting points using R (the function getGraphicsEvent()):
par(bg = "black", mar = rep(0, 4), pch = 20)
xx = runif(100)
yy = runif(100)
plot(xx, yy, type = "n")
mousemove = function(buttons, x, y) {
    r = 0.2
    idx = (x - r < xx & xx < x + r) & (y - r < yy & yy < y + r)
    plot(xx, yy, type = "n")
    rect(x - r, y - r, x + r, y + r, border = "yellow", lty = 2)
    points(xx[idx], yy[idx], col = "yellow", cex = 2)
    points(xx[!idx], yy[!idx], col = "red")
    NULL
}
mousedown = function(buttons, x, y) {
    "Done"
}
getGraphicsEvent("Click mouse to exit", onMouseDown = mousedown,
    onMouseMove = mousemove)
We can adjust the parameter r as we wish.
