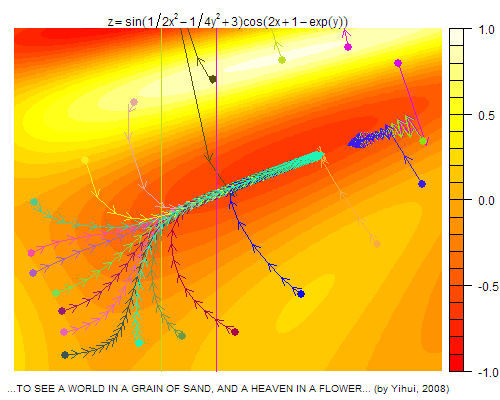
Yesterday Fan J asked me for a cover design of the statistical journal of graduates of our school, and I just remembered the gradient descent algorithm, as this design should have something to do with statistics.
I always insist that students (as well as many researchers in the field of statistics) have ignored the great importance of statistical computation. For example, every now and then I can see presenters prefer to stop going further when they come to an issue related to computations; logistic regression is just a very typical topic. Rarely have I seen any authors mentioned the process of estimating parameters in logistic regression, what’s more, some authors just tell us to find the roots of a series of partial derivative equations (as if they were quite easy to solve by hand), which is a conventional method in optimization – I just cannot see where “IWLS” or “Fisher Scoring” are mentioned. Thus I designed this picture to emphasize the importance of statistical computation.

The function is z = sin(1/2 * x^2 - 1/4 * y^2 + 3) * cos(2 * x + 1 - exp(y). It is a little complex. The meaning of the above plot lies in:
- The process of optimization can be beyond our expectation. It is similar to our life to some extent: many people can achieve their goals, no matter which road they chose in the past (initial values for the iteration). The points in the bottom-left have expressed this idea. However, there are always some poor guys whose roads are not so smooth: they might fail many times before they succeed eventually – see the black point in the top. While there are even poorer guys who struggled for their whole life but still failed in the end – see the two vertical traces. After such an illustration, I think people will not be superstitious in statistical software any more.
- We should adjust our directions to achieve our goals faster. This is just the idea of “gradient”, and such an implication is quite appropriate as an instruction to leading our life, isn’t it?
My ideas may sound like ridiculous, but I believe there are too much to learn from trifles. That’s why I decided to name this graph as “To see a world in a grain of sand”.