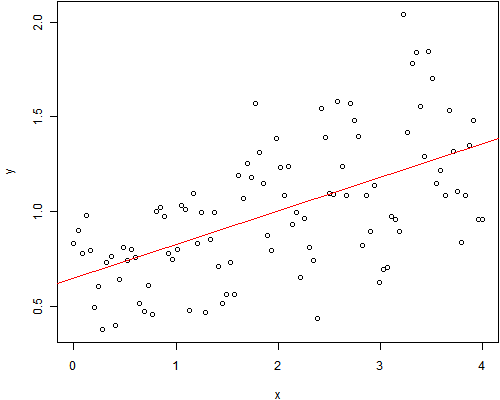
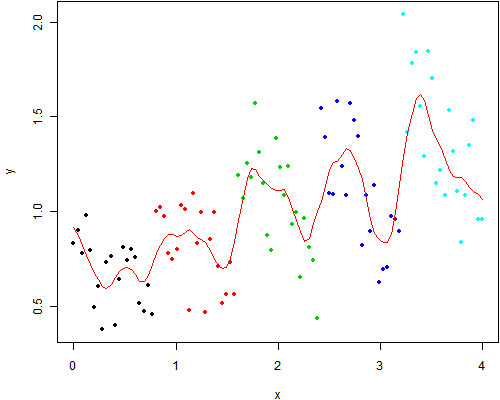
同一个数据,同一个梦想?不一定。有人学了很久回归,却没有理解多元回归到底是要干嘛。

> summary(lm(y ~ x))

Call:
lm(formula = y ~ x)

Residuals:
      Min        1Q    Median        3Q       Max
-0.633978 -0.229549 -0.004557  0.208477  0.821191

Coefficients:
            Estimate Std. Error t value Pr(>|t|)
(Intercept)  0.65277    0.05837  11.184  < 2e-16 ***
x            0.17580    0.02521   6.973 3.65e-10 ***
---
Signif. codes:  0 '***' 0.001 '**' 0.01 '*' 0.05 '.' 0.1 ' ' 1

Residual standard error: 0.294 on 98 degrees of freedom
Multiple R-squared: 0.3316,  Adjusted R-squared: 0.3248
F-statistic: 48.63 on 1 and 98 DF,  p-value: 3.646e-10

> summary(lm(y ~ x + z))

Call:
lm(formula = y ~ x + z)

Residuals:
      Min        1Q    Median        3Q       Max
-0.420562 -0.157195  0.008745  0.152034  0.432706

Coefficients:
            Estimate Std. Error t value Pr(>|t|)
(Intercept)  0.20056    0.06235   3.217  0.00176 **
x           -0.68557    0.09013  -7.606 1.82e-11 ***
z            0.72498    0.07433   9.753 4.57e-16 ***
---
Signif. codes:  0 '***' 0.001 '**' 0.01 '*' 0.05 '.' 0.1 ' ' 1

Residual standard error: 0.21 on 97 degrees of freedom
Multiple R-squared: 0.6626,  Adjusted R-squared: 0.6556
F-statistic: 95.23 on 2 and 97 DF,  p-value: < 2.2e-16
数据来源:
set.seed(711)
x = seq(0, 4, length = 100)
y = -x + jitter(rep(1:5, each = 20), 2)
z = rep(1:5, each = 20)
par(mar = c(4, 4, 0.1, 0.1))
plot(x, y)
abline(lm(y ~ x), col = "red")
plot(x, y, pch = 20, col = z)
lines(lowess(x, y, f = 0.1), col = "red")
summary(lm(y ~ x))
summary(lm(y ~ x + z))
注意本例中局部平滑函数lowess()函数的应用。