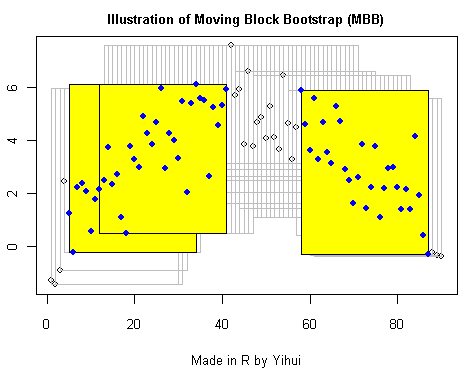
My R code for illustration:
x = 5 * sin(seq(0, pi, length = 90)) + rnorm(90)
plot(x, main = "Illustration of Moving Block Bootstrap (MBB)")
for (idx in 1:(length(x) - 30 + 1)) {
    rect(idx, min(x[idx:(idx + 30 - 1)]), idx + 30 - 1, max(x[idx:(idx +
        30 - 1)]), border = "gray")
    Sys.sleep(0.5)
}
bt = sample(1:(length(x) - 30 + 1), 3, rep = T)
for (b in bt) {
    rect(b, min(x[b:(b + 30 - 1)]), b + 30 - 1, max(x[b:(b +
        30 - 1)]), col = "yellow")
    points(b:(b + 30 - 1), x[b:(b + 30 - 1)], col = "blue", pch = 19)
}